NASA ECLIPSES EXPECTATIONS
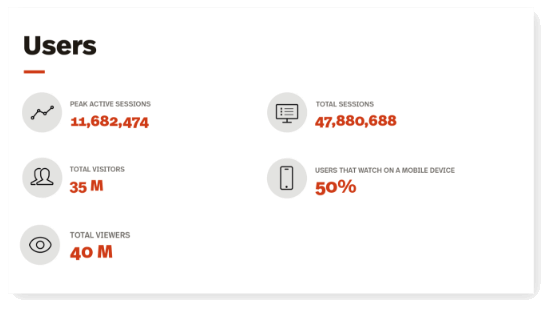
Over 40 million people visited the NASA’s website for the six-hour coverage of the spectacular astrological phenomena. There were peaks of over 2 million concurrent viewers of the live video stream, with a total of over 12.1 million unique viewers. This is 3-4 times more online viewership than the Super bowl in 2016. The average amount of time spent on the site was between 3-4 minutes – which, for those of you unfamiliar with digital media analytics, is pretty high.
Over 40 million people visited the NASA’s website for the six-hour coverage of the spectacular astrological phenomena. There were peaks of over 2 million concurrent viewers of the live video stream, with a total of over 12.1 million unique viewers. This is 3-4 times more online viewership than the Super bowl in 2016. The average amount of time spent on the site was between 3-4 minutes – which, for those of you unfamiliar with digital media analytics, is pretty high.
WHAT DID WE DO?
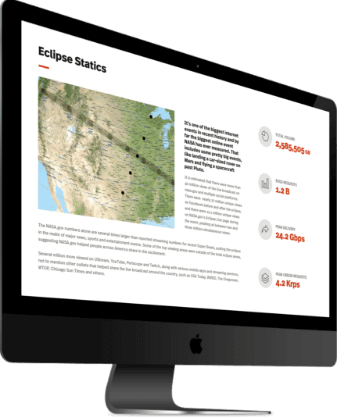
We developed a high-performing live stream solution that supported 18 live feeds from telescopes, high-altitude weather balloons, and ground-based views of the eclipse from across the country. Additionally, we developed a dynamic eclipse-tracker tool that allowed the public to view the eclipse shadow’s progress across the continental U.S. in real-time, as well as fast-forward the eclipse to calculate the optimal viewing time based on their location. Lastly, we optimized NASA.gov's cloud-based architecture to seamlessly scale to accommodate millions of simultaneous viewers on both mobile and desktop devices.
HOW DID WE DO IT.
The Eclipse Live video streaming solution was architected in such a way that minimized load impacts to both the website’s infrastructure and the public viewers. To accomplish this, our team developed a dynamic video player solution that provided seamless transition between video feeds, even though the feeds originated from different service providers. We did so by having an HTML5 embed player dynamically ‘destroy and recreate’ itself to load selected video streams. To keep the page load at a minimum, we stored the various page assets within Amazon S3 to limit the number of requests being made to the back-end services.
For the Eclipse Live shadow-tracker, our team built a custom map overlay that showed not only the shadow of the eclipse, but the different degrees of visibility along the path of totality. We then programmed a time loop synchronized with the exact time of the eclipse. Additionally, we added options for fast-forwarding the shadow’s progress, which simply accelerated the timer component, to allow people to see what time would be best for them to step outside and check out the eclipse in their area.
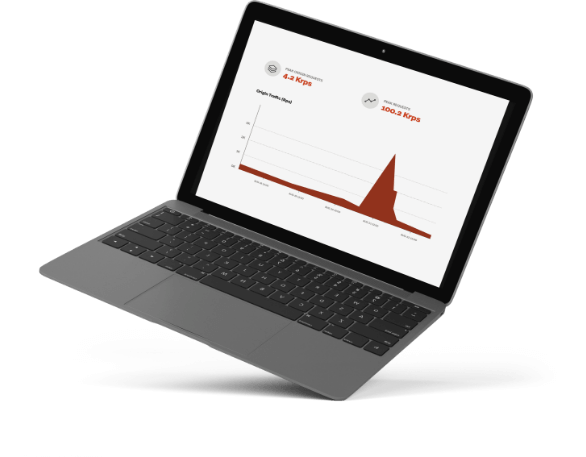
Arguably the most difficult task was optimizing NASA.gov’s architecture to handle the high volumes of web traffic during the event, the challenge being that we didn’t know how much traffic to expect. We worked with NASA to develop our testing benchmarks and then contracted with Web Performance Inc. to perform enhanced load tests that simulated over 1.5 million simultaneous users visiting the website and more specifically our Eclipse Live page. We used the results of the tests to make modifications to our content delivery network (CDN) service as well as some changes to our AWS instance configurations. All-in-all, we exceeded our own expectations as the application performance remained high throughout the event, even when we peaked at over 2 million simultaneous users, the highest in history for a federal government website.
WHY DID WE DO IT.
NASA is committed to providing the best educational resources for its programs as well as its live event coverage. As a leader in technological innovation in the federal space, NASA was focused on ensuring this historic, once-in-a-lifetime eclipse event, could be shared by millions across the world through a high-performance solution. We are very honored to be a part of such a driven and innovative team and to have played a role in this monumental event.
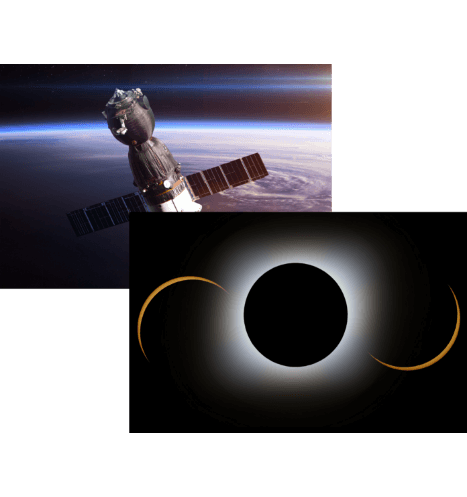
On a day where millions experienced a once in a lifetime total solar eclipse, NASA’s tireless efforts to provide the public with a seamless live-streaming experience of eclipse feeds from across the country resulted in one of the largest web-based events U.S. government history.
NASA’s coverage of the eclipse was a homerun in the IT world and is a testament to the Agency’s commitment to technological excellence in everything they do in support of both their scientific endeavors and their duty to share their experiences with the world, showing that IT collaboration and partnership in the federal government is not only possible but wildly successful.
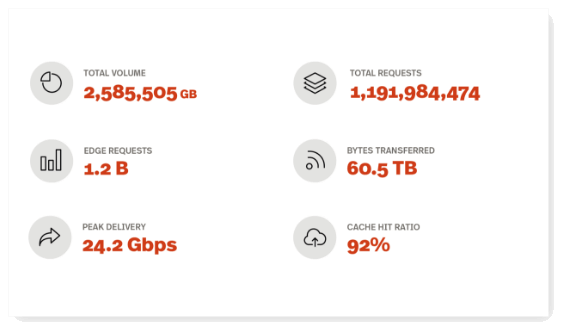
On Monday, NASA surpassed expectations, streaming 18 live feeds from across the country, including high-altitude balloon feeds, telescope views and shots from various aircraft situated along the path of totality from Oregon to South Carolina. Just as impressive as the content being served was the amount of web-traffic NASA.gov received, recording over 30 million visitors over its 6 hours of coverage, resulting in over 80 million page views and at peak levels, sustained over 1.5 million concurrent users – all of which are record-shattering statistics for the Agency.
Livestreaming is no easy feat. An architecture in which supports millions who are livestreaming is even harder. Not being able to accurately guess or predict just how many viewers would tune in and then planning for an architecture to support an unknown amount is unthinkable, until Monday.
"We were in uncharted territory. We predicted that this would be our most watched event, but we didn’t really know to what level,” Nagaraja said. “Mobomo had the arduous task of testing [the site] to the limits that they possibly could and then being able to build something that could scale to the level above that depending on what happened on eclipse day."
Crucial to the success of the eclipse coverage was ensuring that NASA.gov sustained high performance levels under considerable levels of users visiting the website, which required significant planning and collaboration between NASA and members of the WESTPrime contract team, who manage both application development and the backend cloud-based infrastructure.
In addition to developing the main Eclipse Live page and an interactive solar eclipse map tracker, which allowed users to view the real-time progression of the eclipse across the continent, we were also tasked with stress-testing the website and its backend infrastructure to ensure it would perform at a high level under significant increases in user traffic. It was impossible to know just how many users would tune in to watch the event which made it very difficult to test.
Mobomo was responsible for building the backend of the web page and created the interactive graphic that tracked the eclipse in real time which allowed for people to find the best viewing time for their geographic location. The biggest unknown was user testing, we were able to bring on a consultant to run a stress test on the site and simulate millions of people using the site at once. At the same time the consultant ran the test, Mobomo team had a few people head to the site to see how it felt. He didn’t tell them that at that very moment about over a million users were also on the site doing the same thing.
WHAT MAKES THIS PAGE UNIQUE?
NASA is the only known federal agency to use the Cloud for such a large viewing event. The Cloud was optimal in this case because of its elastic scalability and due to the amount of unknown users - we didn't have to change the infrastructure because it is elastic and can scale automatically. Another advantage of the Cloud in this case was the fact that we didn't have hardware to coordinate and manage - which ultimately results in cost savings. Commercial has been doing this before but in the federal space - it has been done but it hasn't been available to the federal government because of privacy, requirements. Pre- cloud an agency would have to purchase these things.
OVERALL IMPACT.
We were able to utilize multi channels - web, video, social, tv and multiple video feeds. Reality is this will be more of a mechanism and takes more bandwidth because you are incorporating different channels. The difference from an event like the Super Bowl is that the event is hosted by one broadcasting channel like ABC or ESPN. From there those channels are distributing the information starting from TV and then going out to web and social.
ELEGANT
SOLUTIONS
START
HERE.
Content-rich websites. High-performance mobile apps. Bulletproof cloud solutions. Bring us your toughest challenge and we’ll show you the path to an elegant solution.
Contact Us